


Overview
If your Linux server or PC takes longer to boot than usual, identifying the cause is essential to reducing unnecessary delays. Using the systemd-analyze command, you can effortlessly measure total boot time, trace bottleneck services, and verify unit files. This article covers key analytical commands and performance optimization techniques you can immediately put into practice.
1. Checking Boot Duration and Measuring Staged Delays (time & blame)
The systemd-analyze command measures and displays the overall time elapsed during the boot process, broken down into kernel and userspace initialization.
Looking at the execution result, you can confirm that it took a total of 315ms for the system to boot up and reach the graphical environment graphical.target.
⚙️ [Key Options]
time: Prints the overall time spent by the kernel and userspace during boot (default behavior).blame: Displays a list of services that caused boot delays during initialization, sorted in descending order of time taken.critical-chain: Displays a service dependency tree for the time-critical chain causing boot delays.plot: Generates an SVG graphical timeline of service executions across the entire boot process.dot: Generates service dependency relationships in Graphviz dot format.

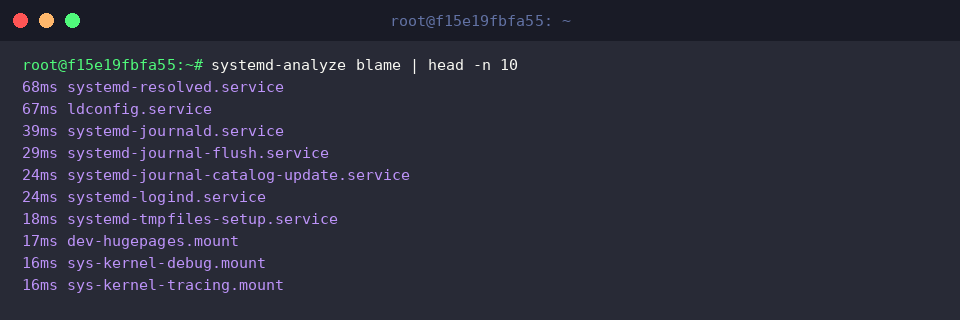
The systemd-analyze blame | head -n 10 command lists the top 10 services with the longest initialization times during boot in descending order.
From the output, you can see that systemd-resolved.service (68ms) and ldconfig.service (67ms) consumed the most time during the boot initialization process.
2. Tracing the Critical Path of Boot Delays (critical-chain)
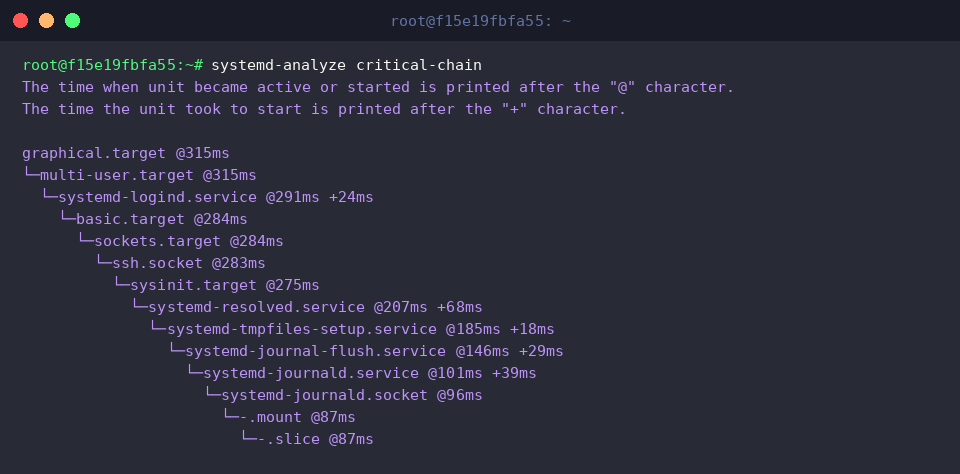
The systemd-analyze critical-chain command prints the dependency tree (critical chain) of services that directly impacted system boot completion.
In the output, the timestamp after the @ symbol indicates the point in time the unit was activated or started, while the duration after the + symbol represents the time spent executing that unit itself.
Reviewing the resulting tree confirms that reaching graphical.target (315ms) involved serialized dependencies such as systemd-resolved.service (68ms) and systemd-journald.service (39ms), pinpointing the primary bottleneck path causing the boot delay.
The systemd-analyze critical-chain networking.service command targets a specific service (in this case, networking.service) to selectively trace the critical chain leading up to its start.
This is useful when you want to isolate and analyze bottleneck dependencies for a specific network or backend service rather than inspecting the entire system path.

3. Generating Boot Timeline Visualization SVG Reports (plot)
To systematically store and manage boot analysis report files, run mkdir -p ~/systemd-reports to create a dedicated directory.

The systemd-analyze plot > ~/systemd-reports/boot-analysis.svg command creates and saves a visual timeline SVG graphic file showing the start times and execution durations of each service during the boot process.
This allows you to intuitively inspect parallel service execution flows and delay periods through a graphical chart that would otherwise be difficult to discern from text logs alone.

The ls -lh ~/systemd-reports/boot-analysis.svg command checks detailed file information, verifying the existence and file size (59KB) of the generated SVG report.
You can open the generated SVG file in a web browser or image viewer to visually analyze the detailed boot timeline chart.
4. Verifying Service Unit Configuration Errors and Security Status (verify & security)
The sudo systemd-analyze verify /lib/systemd/system/ssh.service command pre-validates syntax errors or missing configurations in the specified unit file.
No output upon execution indicates that the service unit file contains no syntax flaws or configuration errors.

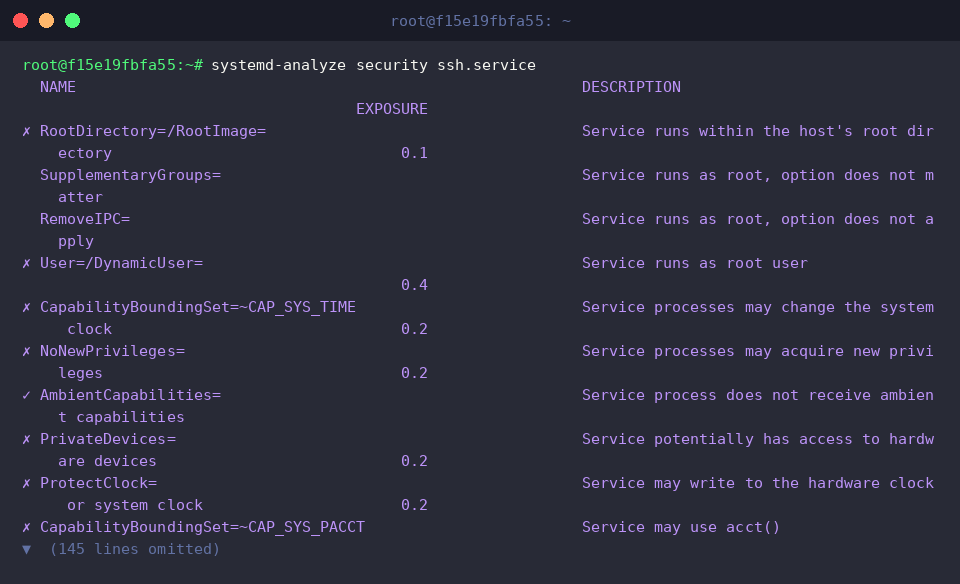
The systemd-analyze security ssh.service command examines the security isolation settings and system exposure level (Security Exposure) of the specified service unit.
The output provides a detailed assessment of risk exposure scores and the status of critical security directives, including root execution privileges (User=), device access controls (PrivateDevices=), and privilege escalation prevention (NoNewPrivileges=).
We have taken a look at how to identify and optimize bottleneck services responsible for boot delays using the systemd-analyze command.
Clean up unnecessary services to create a noticeably snappier and faster Linux boot environment.